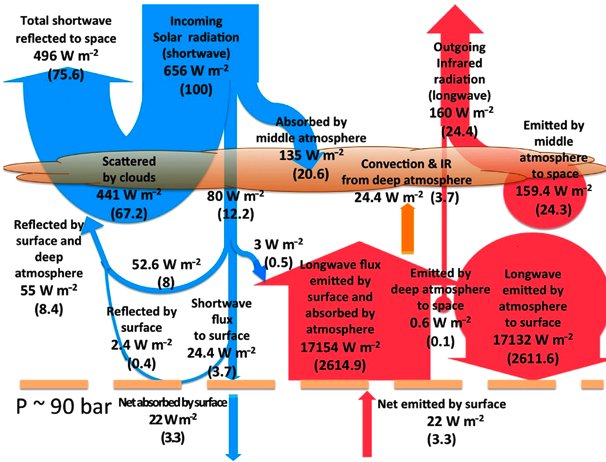
Tuesday, May 31, 2016

Who's Doing Clean Energy

Note 5/31 2 pm: I'm redoing the graphs that were here in terms of carbon-free energy, since there are questions about whether biomass and waste-incinerated energy are "clean." I also added the third plot.

Data via the BP Statistical Review of World Energy 2015. (The 2016 version comes out June 8th.)


renewable sources = wind + geothermal + solar + biomass and waste.

clean energy = nuclear + hydro + wind + solar

1 TWh = 1 terawatt-hour = 1 trillion watt-hours = 3.6 × 10¹⁵ joules

Note that the world is relying more on fossil fuels, not less:


Sunday, May 29, 2016

Uncertainty in CO2's Raditive Forcing < 1%

From a new article in Geophysical Research Letters:


The uncertainties in climate change lie in (1) clouds, and (2) the carbon cycle, not in CO2 or how greenhouse gases interact with infrared radiation emitted by the Earth and its atmosphere. Because the latter are very amenable to fundamental physics, the kind of stuff physicists have spent 300 years getting good at -- read Chapters 2-4 in Pierrehumbert's textbook -- the Planck Law, energy conservation via the two-stream equations, and numerical solutions to the  underlying PDEs using the HITRAN spectroscopic database.

Climate contrarians (quote-unquote) never get this. They want only to argue about CO2.

Trump vs. Data

Trump: “They don’t understand it. There is no drought, they turn the water out into the ocean.”

Data:


Monday, May 23, 2016

Ocean Heat Data Shows the Recent Atmospheric Warming

The latest numbers for ocean heat content, up through the first quarter of this year, show the ocean (well, the top half) has lost heat in the last 12 months.

The top 700 meters lost 0.43e22 Joules, and the top 2000 meters lost 0.54e22 Joules.

Dividing by the surface area of the Earth (because > 90% of the globally trapped heat goes into the ocean; so ocean heat content is the best measure of an global energy imbalance like that being created by manmade GHG emissions), that comes to -0.43 W/m2 and -0.34 W/m2 respectively in the last 12 months.

The same thing happened in the first three months of 1998, at least for the top 700 meters (Argo wasn't yet measuring down to 2000 meters then). Except the loss was larger, -0.92 W/m2 compared to 12 months earlier.

Was the loss lower with this El Nino because even more heat is pouring into the ocean? Much of it, I think -- the 15-year trend for 0-700 m OHC is +0.30 W/m2, which would account for some of the difference.

The acceleration in ocean heat gain for the 0-2000 m region drops slightly, but it still positive at 0.05 ± 0.03 W/m2/yr.


Here was last quarter's report on OHC. 

Here is the portal to NOAA's ocean heat content data and graphs.


Friday, May 20, 2016

"The fall is shorter than he expected."

From The Windup Girl by Paolo Bacigalupi:
"Jaidee raises his foot to drive Akkarat over the precipice but pain blossoms in his back. He stumbles. Blood mists in the air. Spring gun disks rip through him. Jaidee loses his rhythm. The building's edge surges toward him. He glimpses Black Panthers grabbing their patron, yanking him away.

"Jaidee kicks again, trying for a lucky strike, but he hears the whine of more blades in the air, the whir of pistol springs unwinding as they spit disks into his flesh. The blooms of pain are hot and deep. He slams against the edge of the building. Falls to his knees. He tries to rise again, but now the spring gun whine is steady—many men firing; the high-pitched squeal of releasing energy fills his ears. He can't get his legs under him. Akkarat is wiping blood off his face. Somchai is struggling with another pair of Panthers.

"Jaidee doesn't even feel the shove that sends him over the edge.

"The fall is shorter than he expected."

Portland OR School Board Bans Climate Change-Denying Materials

Portland Tribune:
"In a move spearheaded by environmentalists, the Portland Public Schools board un
animously approved a resolution aimed at eliminating doubt of climate change and its causes in schools...."

"The resolution passed Tuesday evening calls for the school district to get rid of textbooks or other materials that cast doubt on whether climate change is occurring and that the activity of human beings is responsible. The resolution also directs the superintendent and staff to develop an implementation plan for 'curriculum and educational opportunities that address climate change and climate justice in all Portland Public Schools.'"
For example:
"In board testimony, Bigelow said PPS’ science textbooks are littered with words like might, may and could when talking about climate change.

"'Carbon dioxide emissions from motor vehicles, power plants and other sources, may contribute to global warming,'  he quotes Physical Science published by Pearson as saying. 'This is a section that could be written by the Exxon public relations group and it’s being taught in Portland schools.'"
Bigelow is right, on the example.

Energy Balance Diagrams From Around the Solar System

These come from Chris Colose on Twitter.

Venus:

Incredible: only 22 W/m2 of sunlight is absorbed by Venus's surface, with 780 times as much from longwave radiation from the atmosphere.


These are all in the fashion of the Trenberth Energy (Im)balance diagram you see everywhere (which ought to be called Trenberth-Fasullo-Kiehl diagram, since it comes from their joint paper):


Even Earth's surface absorbs twice energy from much atmospheric IR as it does from sunlight! 

Wednesday, May 18, 2016

Arctic Sea Ice Just Set an All-Time Record Low(*)

*Tonight's Arctic sea ice extent: 4.06 standard deviations below the mean.

That's the lowest in the records, which start 11/1/1978.

I'm calculating with the daily JAXA data -- daily NSIDC data is still offline. The Arctic sea ice extent value for yesterday, May 17th, was 11.145 million square-kilometers. That's a full 5.2% below last year's value on this date, in a world where the average annual decrease since 1978 has been -0.4% per year.

This year stands out starkly compared to others in this century (click to enlarge):


It stands out even more if you measure the anomaly in standard deviations from the mean. I've taken the baseline as 1981-2010. Using the standard deviation of the anomalies over this period, 2016's anomaly for May 17th, -1.22 Mkm2, is -4.06 standard deviations below the mean (click to enlarge):


That result isn't independent of the chosen baseline, but this is a reasonable baseline and it's still a notable result.

Even the notable lows of Sept 2012 didn't reach 4 stdevs below the mean....

Tuesday, May 17, 2016

An Oregon Poll, Busted

Oregon Public Broadcasting, May 9th:
DHM Research surveyed 901 likely Oregon voters between May 6 and May 9 for OPB and Fox 12. Among Democrats, Clinton led U.S. Sen. Sanders 48 percent to 33 percent. 
Oregonian, tonight:


Wednesday, May 11, 2016

Dr. Norman Page PhD: Still Batshit Crazy

This is rich: Dr. Norman Page, PhD, is still claiming that his 2003 prediction of global cooling "is looking good."

Some people never learn (including some PhDs.). Let us look at the evidence again:


It takes a special kind of dishonesty -- not ordinary denier dishonesty, but something MUCH beyond that -- to look at this graph and claim global cooling is happening, or is at about to happen.
My 2012 forecast of a cooling trend from 2003 on is looking good with the rapid collapse of the current El Nino. See figs 5 and 5a above.The cooling trends are truncated to exclude the current El Nino as an end point. The Enso events are temporary aberrations which don’t have much influence on the trends – see the 1998 and 2010 events in Figs 5 and 5a
Starting in 2003 doesn't make his prediction any less insane:


In fact, his prediction made no sense BEFORE the El Nino, as the trend here from Jan 2003 to his prediction in Nov 2012 is +0.05 C/decade, +/- some relatively large uncertainty that doesnt't help his case at all.

I can maybe perhaps understand this kind of ridiculous thing from those here who have no or little scientific training. But from a PhD???

Really, I don't know how deniers live with themselves, how they lay down at night and think over their day, how they get up in the morning and look themselves square in the mirror.

I really don't.

Yes, You Have to Read Them Too

SciHub

Tuesday, May 10, 2016

Department of Oops: Judith Curry edition

"The models are running too hot. The flat trend in global surface temperatures may continue for another decade or two."

-- Judith Curry, quoted in the Daily Mail, 3/16/13 (written by -- who else? -- David Rose)
As for the models:


via Twitter. Or, from Ed Hawkins (regularly updated):


RealClimate has a very good recent post on comparing models and satellite data.


Wednesday, May 04, 2016

Kimmel (Ruined)

"There's no debate about the greenhouse effect, just like there's no debate about gravity. If someone throws a piano off the roof, I don't care what Sarah Palin tells you, get out of the way because it's coming down on your head."

Funny -- except for the very end, which kind of ruins it. I don't think there's anything funny (or original) about training some little kid to say the word fuck on camera.

center>

A Weird Ice Spike

As I've written about before, since moving to Salem, Oregon I get a lot of ice spikes in my ice cube trays. (Then I wrote about ice spikes for Physics World magazine; I'm especially proud of the article's title!) They keep showing up, maybe twice a month -- and I only refill my ice cube trays about once a week, if that, so they show up on a fair precentage of newly filled trays.

Today I found the most needle-like spike yet:


More About the Airborne Fraction of CO2

After writing this post, I went looking around a bit to see what's in the literature.

I came across Canadell et al, PNAS (2007), which gives the results below saying that the global airborne fraction is slightly increasing with time, because the ocean is taking up less CO2:

At first I thought that calculating the ocean's uptake of CO2 might be relatively straightforward (which is not to say easy), but now I'm thinking probably not, as you'd need to know the ocean's temperature as a function of locale and depth, because Henry's constant varies with temperature. But it might make a nice back of the envelope calculation....